

Increasing scale and complexity of portfolio investments demands reimagining how modern fund managers track information and derive insights improving decision-making
Portfolio monitoring has become far more complex than it often appears on a slide. Today’s private markets track more companies across more rounds, instruments, fund vehicles and currencies, while a growing set of stakeholders expects clear, consistent answers—on demand. Yet despite this increasing complexity, many investment teams across fund houses still rely on processes built around scattered Excel files, outdated decks and buried email attachments.
Critical information—investment details, valuations, KPIs and assumptions—frequently sits across different folders, formats and versions. Analysts repeatedly rebuild IRR and MOIC calculations, budget-versus-actual views and investment committee comparisons for every review cycle. Each pack prepared for LPs, GPs or ICs becomes a bespoke exercise rather than part of a scalable, repeatable process. As portfolios expand and scenarios multiply, the risk of inconsistency and manual error rises sharply, making it increasingly difficult to maintain a single, reliable view across portfolio companies.
Surely in the age of AI this should be an easy problem to solve?
As we spoke with fund managers the need was clear. But the solution complex. The magnitude of information and varying formats along with clear requirement of definitive and not probabilistic outcomes meant that there is a need for dynamic structuring and storage of data which can only then be enhanced with AI.
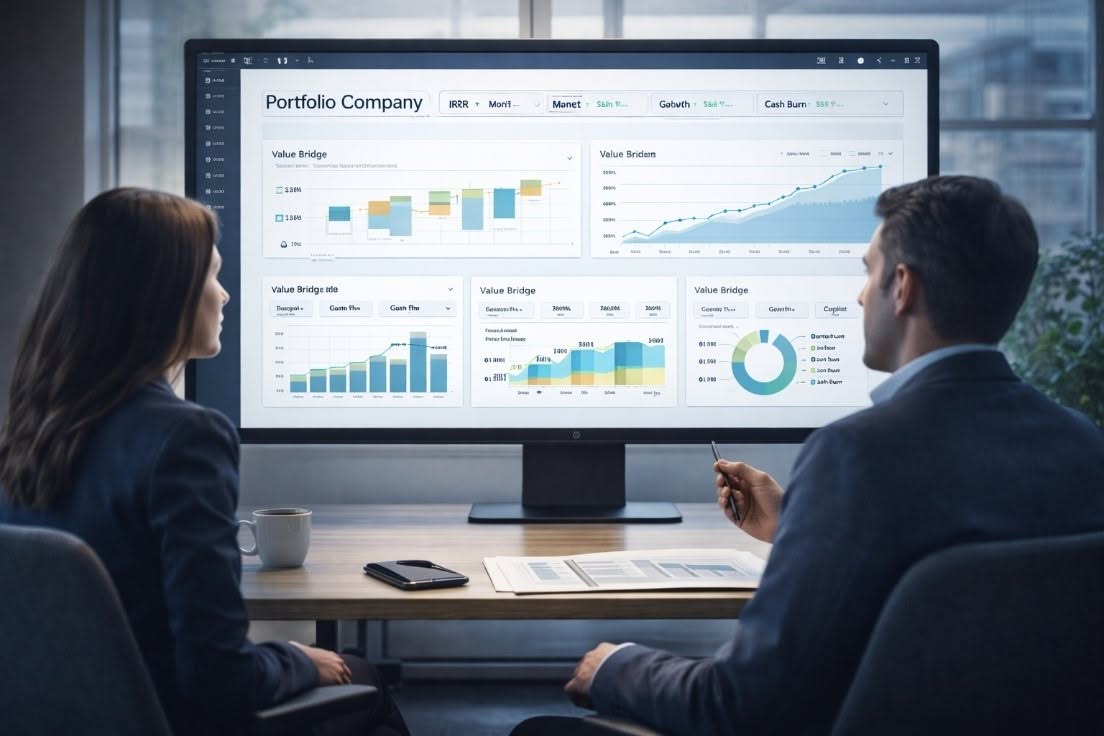
This is the challenge CapHive’s Portfolio Company Dashboard is designed to address. The dashboard sits at the centre of portfolio monitoring, consolidating critical siloed information for each company into a single, coherent and always-on view, so every review builds on the last instead of starting from scratch. Company profile, sector, ownership, investment rounds, instruments, currencies and the evolution of fair value are unified in one place—enabling teams to move efficiently from raw data to actionable insight.
Financials and KPIs are organised into company-specific, configurable views across multiple scenarios, treating them as different perspectives on the same business rather than separate models that need to be maintained independently. CapHive’s advanced analytical capabilities automate complex computations—such as IRR, MOIC and TVPI—across dates, scenarios and currencies, delivering a far more granular understanding of performance trends with minimal manual effort.
As a result, the focus of portfolio reviews shifts decisively from data preparation to interpretation. Budget-versus-actual performance, scenario comparisons and valuation movements can be examined directly within the platform, without rebuilding templates or reconciling spreadsheets. Dynamic, interactive charts and tables show how key metrics evolve over time. The value bridge, for example, clearly breaks down what has driven valuation changes—whether growth, margins, multiples or capital structure—allowing teams to see immediately where value is being created and where it is being eroded.
Multiple financial views can be examined side by side within a clean, intuitive layout, making it easier to connect high-level outcomes with their underlying drivers. Cap table visuals, embedded models and a secure data room keep all relevant context anchored to the numbers, ensuring committees are not forced to jump between tools during critical discussions.
CapHive, then brings in AI in a focused, high-impact way, building on the structured data and documents already housed within the platform. The system automatically generates rich analytical views on user-defined themes—such as company overviews, risk analysis, key milestones and updates, or expansion plans as well as enabling dynamic analytics. Instead of manually piecing information together for every review, analysts receive a powerful, pre-structured starting point that surfaces what is most relevant. These outputs remain fully editable, allowing teams to apply judgement, nuance and their own house views.
Tailored access to well-structured data also enables users to Chat with your portfolio data and crate a range of bespoke comparative analysis of portfolio companies.
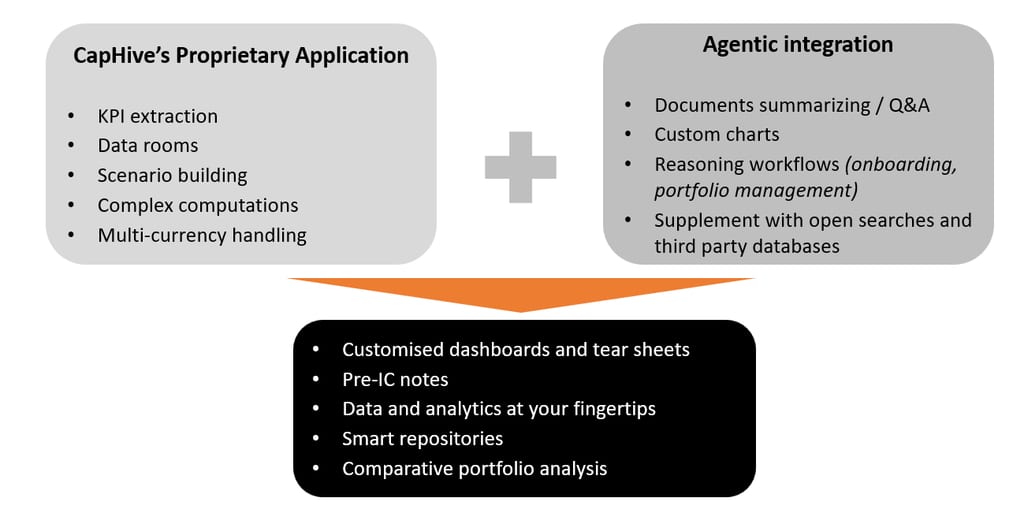
All these pieces are then integrated with our powerful and highly customizable document generator to create a arrange of portfolio tear sheets / LP reporting templates, which can operate at scale and enabling the high value resources of a fund are focused on analytics rather than information collation and formatting.
By turning portfolio monitoring into a structured, automated and repeatable process—with significantly greater analytical depth—CapHive’s Portfolio Company Dashboard unlocks use cases that were previously too time-consuming to execute consistently. For investment teams, this translates into more standardised reviews, sharper visibility into performance and valuation drivers, and far better use of scarce analyst time. Built to support how funds already work—enhanced by a unified data layer, powerful analytics and targeted AI-driven automation—CapHive delivers a portfolio review process that is more rigorous, scalable and aligned with the realities of modern investing.